Coronary artery disease (CAD) results from plaque buildup in coronary arteries that restricts blood flow to the heart.1 Percutaneous coronary intervention (PCI) is a widely used, minimally invasive treatment for narrowed or blocked arteries.2 However, 20% of patients experience cardiovascular events or death within the first year after PCI.2 Major adverse cardiovascular events (MACE) commonly include cardiovascular mortality, non-fatal myocardial infarction, and stroke (3-point MACE), and are sometimes expanded to include heart failure, unstable angina, revascularisation, and all-cause mortality.3
While guidelines provide detailed treatment protocols, recommendations for assessing MACE risk remain unclear.3 Existing prognostic models such as the SYNTAX and Global Registry of Acute Coronary Events (GRACE) scores are often too complex for routine use.45 The Age, Creatinine, and Ejection Fraction (ACEF) score offers a simpler alternative. Initially developed for mortality prediction in cardiac surgery and later validated for PCI,678910 its simplicity and practicality led to endorsement by the European Society of Cardiology in its myocardial revascularisation guidelines, an endorsement which was reaffirmed in 2014 and 2018.1112 Although originally developed to predict mortality outcomes, recent studies have explored its utility in assessing MACE, suggesting that the three universal factors may serve as surrogates for comorbidity burden and overall health status.1314 This study furthers this enquiry by systematically evaluating the ACEF score’s predictive performance in CAD patients undergoing PCI.
Methods
This meta-analysis adhered to the 2020 Preferred Reporting Items for Systematic Reviews and Meta-Analyses (PRISMA) guidelines,15 following a stepwise approach to study identification, screening, eligibility assessment, and inclusion, as detailed in the section below and as summarised algorithmically in the PRISMA flow diagram (Figure 1). The study was registered in the PROSPERO database (CRD42024558580). Three authors independently searched the Scopus, ScienceDirect, PubMed, ProQuest, EBSCOhost, and Cochrane databases from inception until 30 June 2024.
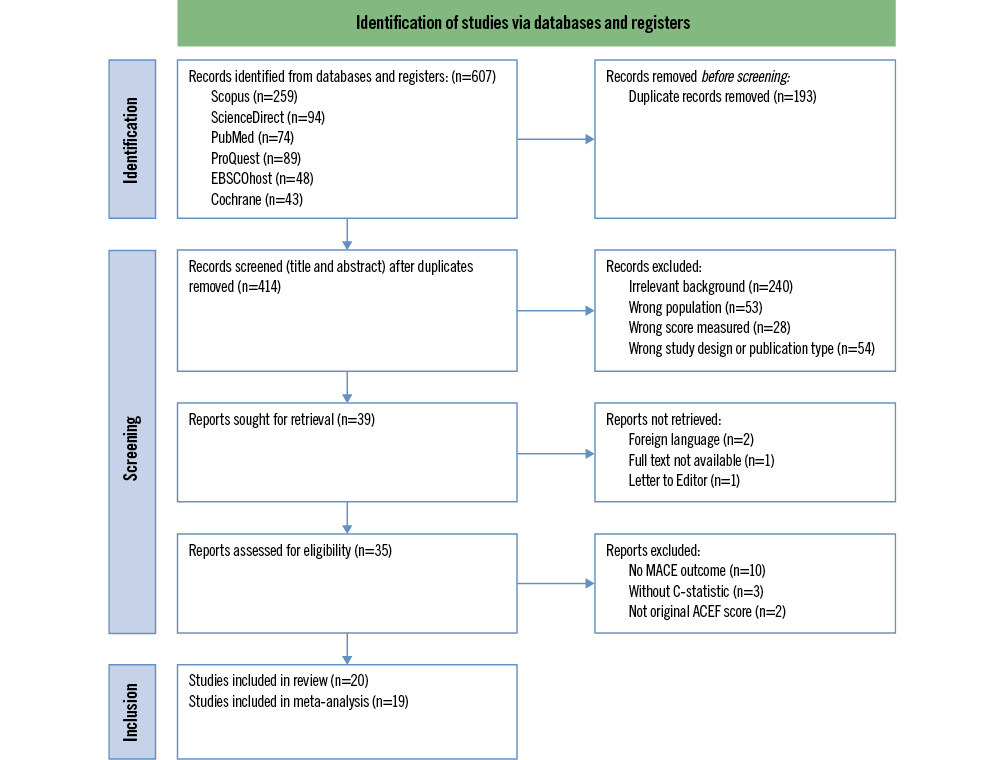
Figure 1. PRISMA 2020 flow diagram of study screening and selection. ACEF: Age, Creatinine, and Ejection Fraction; C-statistic: concordance statistic; MACE: major adverse cardiovascular events; PRISMA: Preferred Reporting Items for Systematic Reviews and Meta-Analysis
Search strategy
The search strategy used Medical Subject Heading (MeSH) terms and Boolean operators (AND, OR) to identify relevant studies. To ensure a comprehensive search, we used the “keywords, abstract, and title” filter with the following keywords: (“Acute Coronary Syndrome” OR “ACS” OR “Myocardial Infarction” OR “AMI” OR “STEMI” OR “ST Segment Elevation Myocardial Infarction” OR “ST Elevation Myocardial Infarction” OR “NSTEMI” OR “Non-ST Elevation Myocardial Infarction” OR “Non ST Elevation Myocardial Infarction” OR “Angina Pectoris”) AND (“PCI” OR “Percutaneous Coronary Intervention”) AND (“ACEF Score” OR “Age, Creatinine, Ejection Fraction Score”) AND (“Major Adverse Cardiovascular Event” OR “MACE” OR “Major Adverse Cardiac and Cerebrovascular Event” OR “MACCE” OR “Mortality” OR “All-cause death”).
Eligibility criteria
The predefined eligibility criteria for inclusion were as follows: (1) full-text validation studies of the original ACEF score in CAD patients undergoing PCI, (2) available outcome data on MACE, (3) reported concordance (C)-statistics (area under the curve [AUC]), and (4) publication in English. The original ACEF score, as defined by Ranucci,10 is calculated using the following formula: age/left ventricular ejection fraction+1 (if serum creatinine is ≥2.0 mg/dL). Studies that did not meet these criteria were excluded. Due to the significant variation in MACE definitions across the studies, no specific eligibility criterion was applied based on its components. Instead, we assessed the outcome definitions of the included studies for risk of bias.
Study selection and data extraction
Five authors independently screened and selected studies from all databases for inclusion. The decisions were blinded to other reviewers and compiled using the Rayyan platform (www.rayyan.ai). A minimum of three similar decisions was required to include or exclude a study. Any disagreements were discussed and resolved collaboratively under the supervision of authors R.A. Fagi and S.D. Rasti. The selected studies were assessed to extract the following information: first author’s name and publication year, study design, study characteristics (country, study centre, study period), definition of variables, participant demographics and baseline characteristics, and discrimination and calibration of the endpoints. The primary endpoint was MACE, with secondary endpoints including mortality and modifications of the ACEF score (if a minimum of two studies were available for the analysis). All endpoints were categorised based on the time or follow-up period.
Quality assessment
The Prediction model Risk of Bias ASsessment Tool (PROBAST) was used to assess the risk of bias in each retrieved validation study of the ACEF score.16 This tool critically appraises risk stratification models by evaluating four domains: participants, predictors, outcome, and analysis.
Effect size estimation
In its original validation, the ACEF score demonstrated a sensitivity of 71% and a specificity of 78% for predicting mortality in elective cardiac surgery. However, because the ACEF score is intended to be applied as a continuous risk model, its prognostic performance is more appropriately evaluated using discrimination and calibration metrics in broader clinical settings.10 Discrimination evaluates a model’s ability to differentiate between patients who develop the outcome and those who do not, often measured by the C-statistic.17 The C-statistic ranges from 0.5 (no discrimination) to 1 (perfect discrimination), representing the area under the receiver operating characteristic curve in logistic regression models.17 C-statistic values are categorised as (a) excellent (0.90-1), (b) good (0.80-0.89), (c) fair (0.70-0.79), (d) poor (0.60-0.69), and (e) failed (0.50-0.59).17 For this meta-analysis, C-statistics and their 95% confidence intervals (CIs) were extracted, or calculated if missing, and the CIs were used to compute standard errors (SEs).
Calibration assesses how accurately a model predicts risk probabilities by comparing predicted outcomes with observed outcomes.17 Ideally, calibration is reported graphically using calibration plots. However, extracting calibration measures can be challenging because of poor assessment and reporting practices.17 Some studies directly provide calibration via the slope or intercept. A slope less than 1 suggests overestimation of risks, while a slope greater than 1 indicates underestimation.17 The observed-to-expected ratio is another method, with ratios between 0.8 and 1.2 considered acceptable.17 The Hosmer-Lemeshow test is also used to evaluate model fit, with a small p-value (<0.05) indicating poor fit and a larger p-value suggesting a good fit.17
Statistical analysis
We performed a meta-analysis using logit-transformed AUC values to stabilise variances and normalise the distribution.17 The logit transformation for the C-statistic is calculated as log(Ci/[1−Ci]).17 Random-effects meta-analysis using the restricted maximum likelihood approach was performed to pool C-statistics in their original or logit forms. The pooled logit-transformed AUC and its confidence intervals were back-transformed to the original AUC scale for presentation. Original C-statistics and SEs were analysed using the “metamisc” package in RStudio, version 4.2 (Posit), while logit-transformed data were processed with an inverse variance random-effects model in Review Manager, version 5.4.1 (Cochrane). Back-transformation was conducted using the ALOGIT function in MedCalc (MedCalc software; https://www.medcalc.org/manual/alogit-function.php). Heterogeneity across studies was evaluated using the Q statistic and Higgins I², with thresholds of 25-50% (mild), 50-75% (moderate), and >75% (severe). A leave-one-out sensitivity analysis was conducted to assess the influence of each study on the overall results. Whenever possible, adjusted analyses were performed based on similar MACE definitions to enhance validity and statistical power.
Results
A visual summary of the study findings is provided in the Central illustration. The initial search yielded 607 articles. After removing duplicates, 414 articles were screened and reviewed based on predefined selection criteria. The complete selection process is depicted in the PRISMA diagram (Figure 1). Ultimately, 20 articles involving a total of 41,255 patients were included in the review. One study was excluded from the meta-analysis because of missing 95% CI data and unreported positive events.18 Supplementary Table 1 presents the risk-of-bias assessment using the PROBAST scale.16 The relevant characteristics of the 20 eligible studies are summarised in Table 1, with additional study characteristics provided in Supplementary Table 2. Of these, three studies were randomised controlled trials,181920 and eight were multicentre studies.46181920212223 Details of each study’s discrimination and calibration outcomes are provided in Supplementary Table 3–Supplementary Table 4–Supplementary Table 5–Supplementary Table 6, while a summary of the discrimination analysis outcomes is compiled in Table 2. In all subgroup outcomes, the original and back-transformed logit AUC yielded identical pooled AUC values, with only minor differences in the 95% CIs.
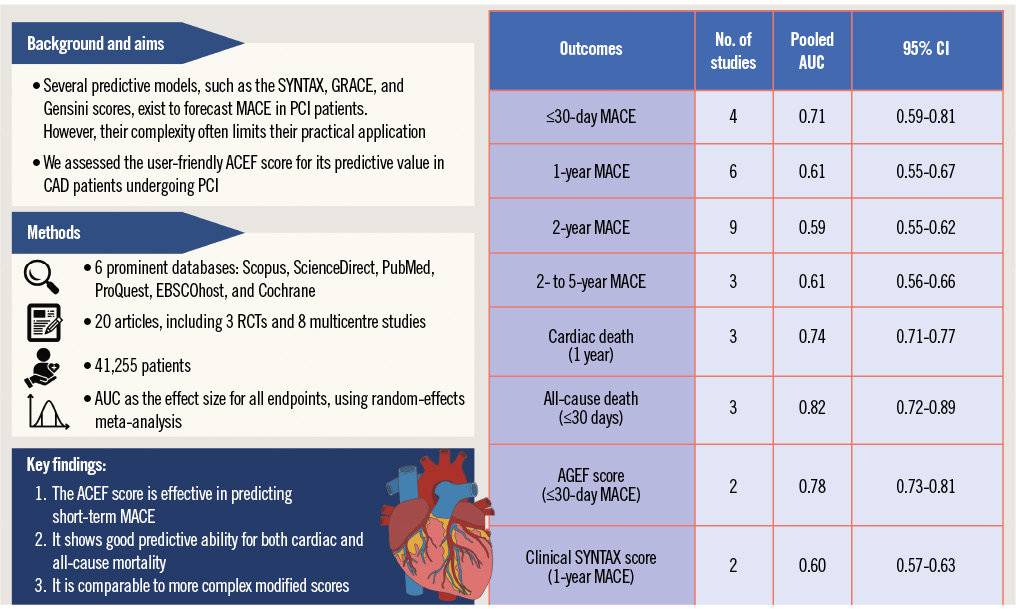
Central illustration. ACEF score and its predictive performance in coronary artery disease patients undergoing PCI. ACEF: Age, Creatinine, and Ejection Fraction; AGEF: Age, Glomerular filtration rate, and Ejection Fraction; AUC: area under the curve; CAD: coronary artery disease; CI: confidence interval; C-statistic: concordance statistic; GRACE: Global Registry of Acute Coronary Events; MACE: major adverse cardiovascular events; PCI: percutaneous coronary intervention; RCT: randomised controlled trial
Table 1. Characteristics of included studies
| Study | Country | Study design | Sample size | Follow-up duration | ACEF score |
|---|---|---|---|---|---|
| Chichareon et al, 201919 | Multinational | RCT – multicentre | 14,941 | 30 days & 2 years | 1.25±0.43 |
| Biondi Zoccai et al, 201221 | Italy | Cohort – multicentre | 3,535 | 24.4±15.1 months | NR |
| Liu et al, 201624 | China | Cohort – single centre | 422 | 3 years | 1.2±0.5 |
| Liu et al, 202025 | China | Cohort – single centre | 2,260 | 6 (5-9) days | 1.35±0.60 |
| Palmerini et al, 201222 | USA | Cohort – multicentre | 2,094 | 1 year | 1.0±0.4 |
| Wykrzykowska et al, 201120 | Switzerland | RCT – multicentre | 1,208 | 1 year | 1.278±0.539 |
| Zhao et al, 20238 | China | Cohort – single centre | 290 | 14 months | NR |
| Pyxaras et al, 201426 | Belgium | Cohort – single centre | 221 | 30 days and 1 year | NR |
| Gao et al, 201933 | China | Cohort – single centre | 1,146 | 1 year | Low ACEF: 0.8±1.1 Mid-ACEF: 1.07±0.07 High ACEF: 1.55±0.34 |
| Reindl et al, 201831 | Austria | Cohort – single centre | 390 | 2 (1-3) years | NR |
| Garg et al, 201118 | The Netherlands | RCT – multicentre | 1,218 | 1, 6, and 12 months | NR |
| Zhang et al, 201927 | China | Cohort – single centre | 5,375 | 2.4 years | NR |
| Capodanno et al, 201128 | Italy | Cohort – two centres | 949 | 2 years | 1.6±0.7 |
| Wu et al, 20246 | China | Cohort – multicentre | 1,805 | 2.4 years | 1.05±0.31 |
| Qiu et al, 20229 | China | Cohort – single centre | 2,207 | 48 months | 0 risks: 0.83±0.12 1 risk: 1.06±0.52 2 risks: 1.31±0.82 ≥3 risks: 1.80±1.09 |
| Di Serafino et al, 201423 | Belgium & UK | Cohort – multicentre | 433 | 24 months | 1st tertile: 0.81 (0.71-0.88) 2nd tertile: 1.05 (1.00-1.13) 3rd tertile: 1.45 (1.31-1.67) |
| Capodanno et al, 201534 | Italy | Cohort – two centres | 1,300 | 2.7±1.2 years | NR |
| Synetos et al, 201829 | Greece | Cohort – single centre | 685 | 556 (321-836) days | NR |
| Garg et al, 20104 | The Netherlands | Cohort – multicentre | 512 | 1,800 (IQR 0) days | 1.07±0.27 |
| Nakahashi et al, 20187 | Japan | Cohort – single centre | 264 | 4 years | NR |
| Values are mean±standard deviation or median (IQR). ACEF: Age, Creatinine, and Ejection Fraction; IQR: interquartile range; NR: not reported; RCT: randomised controlled trial | |||||
Table 2. Summary of discriminative outcome analysis
| Outcome | Number of studies | Pooled AUC | Pooled 95% CI | I2, % | p for I2 |
|---|---|---|---|---|---|
| MACE | |||||
| ≤30-day MACE | 4 | 0.71 | 0.59-0.81 | 95 | <0.00001 |
| ≤30-day MACEa | 2 | 0.77 | 0.73-0.80 | 0 | 0.87 |
| 1-year MACE | 6 | 0.61 | 0.55-0.67 | 83 | <0.0001 |
| 1-year MACEa | 3 | 0.56 | 0.50-0.61 | 65 | 0.06 |
| 2-year MACE | 9 | 0.59 | 0.55-0.62 | 82 | <0.00001 |
| 2-year MACEa | 4 | 0.55 | 0.50-0.60 | 77 | 0.004 |
| 2- to 5-year MACE | 3 | 0.61 | 0.56-0.66 | 43 | 0.17 |
| Cardiac death | |||||
| 1-year cardiac death | 3 | 0.74 | 0.71-0.77 | 90 | <0.0001 |
| 2-year cardiac death | 2 | 0.75 | 0.65-0.82 | 76 | 0.04 |
| All-cause death | |||||
| ≤30-day all-cause death | 3 | 0.82 | 0.72-0.89 | 86 | 0.0007 |
| 2-year all-cause death | 4 | 0.72 | 0.68-0.75 | 30 | 0.23 |
| 2- to 5-year all-cause death | 2 | 0.78 | 0.50-0.93 | 92 | 0.0005 |
| Modification of ACEF score | |||||
| mACEF (for 2-year MACE) | 2 | 0.56 | 0.50-0.62 | 63 | 0.10 |
| AGEF (for ≤30-day MACE) | 2 | 0.78 | 0.73-0.81 | 0 | 0.51 |
| CSS (for 1-year MACE) | 2 | 0.60 | 0.57-0.63 | 0 | 0.40 |
| CSS (for 2-year MACE) | 2 | 0.60 | 0.41-0.76 | 91 | 0.0008 |
| aAdjusted for the exact matching of the MACE definition. ACEF: Age, Creatinine, and Ejection Fraction; AGEF: Age, Glomerular filtration rate, and Ejection Fraction; AUC: area under the curve; CI: confidence interval; CSS: clinical SYNTAX score; MACE: major adverse cardiovascular events; mACEF: modified ACEF | |||||
Predictive value of the ACEF score in MACE
Supplementary Table 3 provides a summary of the discrimination and calibration outcomes for each study, categorised by the timing of the MACE assessment. The original forest plot is provided in Figure 2, while the logit forest plot is shown in Supplementary Figure 1.
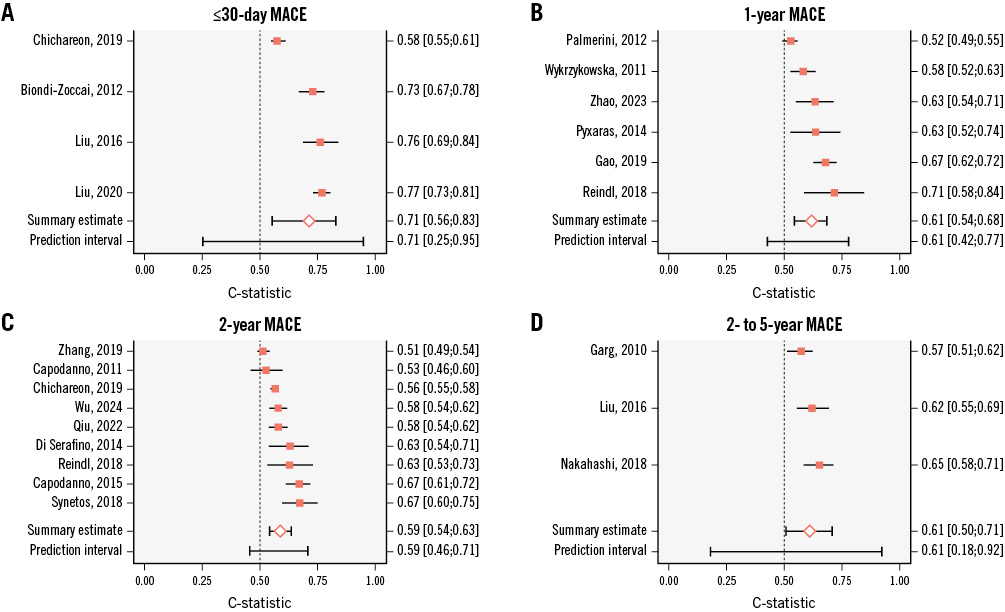
Figure 2. Original forest plots of MACE outcomes. References for each trial can be found in Table 1. A) Short-term MACE; (B) 1-year MACE; (C) 2-year MACE; (D) long-term MACE. C-statistic: concordance statistic; MACE: major adverse cardiovascular events
Short-term MACE (≤30-day MACE)
Short-term MACE refers to outcomes reported either in-hospital or within a follow-up period of 30 days or less. The pooled outcome for ≤30-day MACE demonstrated fair discrimination, with an AUC of 0.71 (95% CI: 0.59-0.8; I2=95%). A leave-one-out sensitivity analysis was performed to address severe heterogeneity. After excluding the study by Chichareon et al,19 zero heterogeneity was achieved, and the pooled discrimination improved (AUC: 0.76, 95% CI: 0.73-0.78; I²=0%). Two studies using a similar 5-point MACE definition were further analysed,2425 resulting in an improved pooled outcome with an AUC of 0.77 (95% CI: 0.73-0.80) and no heterogeneity (I²=0%).
One-year MACE
The pooled results showed poor discrimination for 1-year MACE, with an AUC of 0.61 (95% CI: 0.55-0.67; I²=83%). A leave-one-out sensitivity analysis revealed that the study by Palmerini et al22 contributed to the heterogeneity. After excluding this study, heterogeneity was markedly reduced, and the pooled discrimination improved (AUC: 0.63, 95% CI: 0.58-0.68; I²=46%). Further analysis was conducted on three studies with adjusted MACE definitions,202226 consisting of a composite of cardiac death, myocardial infarction (MI), and target vessel revascularisation (TVR). The pooled result showed poorer discrimination (AUC: 0.56, 95% CI: 0.50-0.61; I²=65%).
Two-year MACE
The pooled results for 2-year MACE demonstrated failed discrimination, with an AUC of 0.59 (95% CI: 0.55-0.62, I²=82%), indicating high heterogeneity. After performing a leave-one-out sensitivity analysis, removing the study by Zhang et al27 resulted in moderate heterogeneity and slightly improved discrimination (AUC: 0.60, 95% CI: 0.57-0.64; I²=69%). Adjusted analysis was performed using a 3-point MACE definition, including all-cause death, MI, and any revascularisation.6232728 The pooled outcome demonstrated poorer discrimination, with an AUC of 0.55 (95% CI: 0.50-0.60; I²=77%).
Long-term MACE (2-5 years)
Long-term MACE refers to outcomes reported from more than 2 years up to 5 years. The pooled analysis showed an AUC of 0.61 (95% CI: 0.56-0.66; I²=43%), indicating poor discrimination. A leave-one-out sensitivity analysis revealed that a study by Garg et al primarily drove heterogeneity.4 After excluding this study, the pooled outcome showed slightly improved discrimination with zero heterogeneity (AUC: 0.63, 95% CI: 0.59-0.68; I²=0%).
Predictive value of the ACEF score in cardiac death
Supplementary Table 4 summarises the discrimination and calibration results of cardiac death outcomes. The original forest plots for cardiac death are shown in Supplementary Figure 2, while the logit AUC is provided in Supplementary Figure 3.
One-year cardiac death
The pooled results for 1-year cardiac death showed fair discrimination, with an AUC of 0.74 (95% CI: 0.71-0.77; I²=90%), suggesting high heterogeneity. After removing the study by Pyxaras et al26 for a leave-one-out sensitivity analysis, zero heterogeneity was achieved, resulting in a pooled AUC of 0.73 (95% CI: 0.72-0.73; I²=0%).
Two-year cardiac death
The pooled results demonstrated fair discrimination for 2-year MACE, with an AUC of 0.75 (95% CI: 0.65-0.82; I²=76%). A leave-one-out sensitivity analysis was not applicable to this subgroup.
Predictive value of the ACEF score in all-cause death
Supplementary Table 5 summarises the discrimination and calibration results of all-cause death outcomes. Supplementary Figure 4 and Supplementary Figure 5 show the original and logit forest plots, respectively.
Short-term all-cause death (≤30 days)
The pooled results for ≤30-day all-cause death demonstrated good discrimination, with an AUC of 0.82 (95% CI: 0.72-0.89; I²=86%). Zero heterogeneity was achieved after removing the study by Liu et al24 in a leave-one-out sensitivity analysis, resulting in a slightly reduced pooled outcome (AUC: 0.77, 95% CI: 0.73-0.80; I²=0%).
Two-year all-cause death
The pooled results for 2-year all-cause death showed fair discrimination, with an AUC of 0.72 (95% CI: 0.68-0.75; I²=30%). The overall heterogeneity was mild, but, after excluding the study by Di Serafino et al,23 no heterogeneity was observed. Following this leave-one-out sensitivity analysis, the pooled outcome remained similar (AUC: 0.71; 95% CI: 0.69-0.73; I²=0%).
Long-term all-cause death (2-5 years)
Long-term all-cause death refers to outcomes reported from more than 2 years up to 5 years of follow-up.The pooled analysis showed fair discrimination, with an AUC of 0.78 (95% CI: 0.50-0.93; I²=92%), indicating significant heterogeneity. There were only two studies in this subgroup,424 making a leave-one-out sensitivity analysis inapplicable.
Predictive value of the modifications of the ACEF score for MACE
Secondary outcomes for modifications of the ACEF score were analysed when at least two studies reported on the same time-based outcome. Two studies compared the ACEF score with the modified ACEF (mACEF) score for 2-year MACE,627 two studies with the Age, Glomerular filtration rate, and Ejection Fraction (AGEF) score for ≤30-day MACE,2425 and two studies with the clinical SYNTAX score (CSS) for 1-year2022 and 2-year MACE,2829 respectively. Discrimination and calibration values are detailed in Supplementary Table 6, while original and logit forest plots are shown in Supplementary Figure 6 and Supplementary Figure 7. The formulae for all modified scores are provided in Supplementary Appendix 1.
Modified ACEF score in 2-year MACE
The mACEF score with the same MACE definition exhibited failed discrimination, with a pooled AUC of 0.56 (95% CI: 0.50-0.62; I²=63%). A leave-one-out sensitivity analysis was not applicable to this outcome. When compared with the adjusted ACEF score, the mACEF score demonstrated the same level of discrimination for predicting 2-year MACE.
AGEF score in ≤30-day MACE
The AGEF score with a matched MACE definition demonstrated somewhat similar performance for ≤30-day MACE compared with the ACEF score after the same MACE adjustment, with a pooled AUC of 0.78 (95% CI: 0.73-0.81; I²=0%). Although a leave-one-out sensitivity analysis was not applicable, there was no observed heterogeneity.
Clinical SYNTAX score
Two studies2022 comparing the CSS with ACEF scores for 1-year MACE also used identical MACE definitions, resulting in better pooled outcomes than the adjusted ACEF score (AUC: 0.60, 95% CI: 0.57-0.63; I²=0%). Meanwhile, the two studies2829 on the CSS for 2-year MACE had significantly different MACE definitions and demonstrated severe heterogeneity, leading to less reliable results, with a pooled AUC of 0.60 (95% CI: 0.41-0.76; I²=91%).
Discussion
The major findings of this study are as follows: (1) the ACEF score is effective for predicting ≤30-day MACE, achieving an acceptable balance between fair discrimination and good calibration, but it shows poor predictive value for other MACE outcomes. 2) The ACEF score demonstrates acceptable discriminative ability for predicting both cardiac and all-cause mortality. 3) The AGEF score and the CSS show similar predictive performance to the ACEF score. To our knowledge, this is the first meta-analysis to evaluate the performance of the ACEF clinical risk score in patients undergoing PCI.
Our findings indicate that the ACEF score is effective for predicting ≤30-day MACE. The incidence of MACE varies across studies, largely influenced by follow-up duration and patient characteristics. For example, MACE rates were reported as 21.7% after a mean follow-up of 0.8±0.3 years following PCI (whether urgent or elective), 47.6% after a median follow-up of 23 months among acute coronary syndrome patients, 19.1% after a median follow-up of 6.1 (interquartile range 5.1-6.9) months following emergency PCI, and 2.78-3.43% within 30 days post-PCI (elective or urgent).30
In contrast, the ACEF score’s performance for other time subgroups, such as 1-year and 2-year outcomes, was unsatisfactory, even after aligning MACE definitions. Significant heterogeneity likely contributed to this limitation. In the 1-year group, by excluding Palmerini et al,22 which focused on non-ST-segment elevation acute coronary syndrome patients, heterogeneity was eliminated, improving the AUC to 0.59 (95% CI: 0.54-0.63). However, the remaining two studies in this group2026 showed significant differences in sample size, CAD criteria, and, in the study by Pyraxas et al26, the additional use of rotational atherectomy. Notably, 64.8% of the population in the study by Wykrzykoska et al20 had moderate to severe calcifications, which might have slightly minimised the differences. Between the two studies, the individual AUC was higher in that by Pyxaras et al26 (0.629), potentially due to the relatively low TVR rate. Since the ACEF score lacks angiographic factors, its limitations in predicting MACE are largely due to its reduced ability to assess the risk of repeat revascularisation.2031 In the 1-year MACE group, the best individual outcome was observed in the study by Reindl et al,31 where the MACE definition excluded revascularisation and focused on ST-segment elevation MI (STEMI) patients.
In the 2-year group, after adjusting the MACE definitions, the AUC value decreased, while the heterogeneity remained high. A leave-one-out approach excluding the study by Zhang et al27 still produced unsatisfactory results (AUC: 0.57, 95% CI: 0.53-0.62; I²=39%). This subgroup exhibited diversity in CAD criteria across the included studies, contributing to the variability in outcomes. The lowest individual outcome was observed in the study by Zhang et al,27 which focused on patients achieving complete revascularisation. This study, comparing 6 scores, including ACEF and mACEF, found none to be effective in predicting MACE, likely due to a low event rate. In contrast, Synetos et al,29 who examined successful PCI in STEMI patients with a higher MACE rate, achieved the highest AUC in the 2-year MACE group. Many factors, such as PCI procedure details, post-PCI complications, and medication adherence, can significantly impact outcomes in these patients.29 Di Serafino et al23 demonstrated that the ACEF score could be more useful for identifying specific patient subsets. Patients in the lowest ACEF tertile had a higher success rate at the first attempt, fewer periprocedural MIs, and lower overall death and MACE rates.23 In contrast, patients in the highest ACEF tertile had worse outcomes, with higher overall death and MACE rates, regardless of whether their PCI was successful or not.23 The ACEF score was able to identify patients with chronic total occlusions who did not gain additional clinical benefits from successful PCI compared with those with failed PCI.23
The pooled outcomes for long-term MACE were comparable to those for 1-year and 2-year MACE. However, further analysis using matched MACE definitions was not feasible. Assessing long-term predictive value is challenging because of extended enrolment periods, during which treatment strategies may evolve. However, several factors could explain the respectable AUC values of purely clinical risk scores like ACEF in predicting long-term MACE. Over longer follow-ups, the influence of angiographic factors from SYNTAX-related scores or acute parameters from the GRACE score (e.g., cardiac arrest, Killip class, abnormal enzymes, electrocardiography changes) may diminish.9 Conversely, fundamental parameters like age, kidney function, and cardiac capacity consistently affect both short- and long-term outcomes, whereas other factors primarily influence short-term prognosis and treatment strategies.49
Next, we analysed the performance of the ACEF score for all available mortality outcomes. Overall, the results were satisfactory, with the ACEF score showing the strongest performance in predicting ≤30-day all-cause mortality. This is consistent with its original design to predict operative mortality, defined as death within 30 days of an operation, regardless of cause.10 Although the ACEF score was also effective in predicting cardiac death, other scores that combine clinical and angiographic variables demonstrated superior predictive power.419
Finally, we reviewed studies comparing the original ACEF score with its modified versions, including the mACEF and AGEF. The original ACEF score showed a performance similar to these variations. The mACEF was developed to enhance accuracy, as serum creatinine alone is an unreliable kidney function marker due to its dependence on muscle mass.32 Capodanno et al emphasised that estimating glomerular filtration rate improves ACEF model calibration, though it minimally impacts discrimination regardless of the renal impairment definition used.32
Combining the ACEF score with the SYNTAX score improves the pooled outcome for 1-year MACE. The inclusion of patient characteristics has been shown to enhance the score’s ability to predict MACE and mortality compared with its original version.19 However, the clinical SYNTAX score is more complex, incorporating 12 angiographic features from the SYNTAX score and three clinical factors from the ACEF score. This complexity increases the risk of overfitting and multicollinearity among risk factors.18 Furthermore, the SYNTAX score relies on subjective angiogram evaluations, potentially causing interobserver variability.
In summary, the ACEF score adheres to the law of parsimony, which suggests that risk factors should not be added beyond necessity.10 Unlike other risk models that include numerous factors to enhance accuracy,18 the ACEF score relies on three standardised, objectively measured variables: age, ejection fraction, and serum creatinine. These variables are non-intercorrelated, enhancing the score’s practicality and effectiveness. Applicable to both surgical and interventional settings, the ACEF score relies on routinely available variables, enabling consistent use across heterogeneous cohorts and making it well suited for large-scale, real-world prognostic analyses. Since its original validation in elective cardiac surgery, ACEF has demonstrated consistent prognostic validity across diverse cardiovascular populations, supporting its clinical utility and generalisability.193133
Limitations
This study has several limitations, primarily the heterogeneity in CAD criteria and MACE definitions across the included studies. Despite efforts to adjust for these differences, variability remains a challenge, as research often involves diverse PCI-treated patient samples, complicating comparisons.31 Future research should target specific populations for risk stratification and consider refining the ACEF score, particularly for outcomes with limited discriminative power. The C-statistic’s insensitivity to changes in absolute risk estimates is another limitation; alternative metrics such as net reclassification improvement and the integrated discrimination index should be explored.22 Additionally, factors such as treatment planning, adherence, comorbidities, and lifestyle habits should be better controlled to improve the ACEF score’s predictive accuracy.
Conclusions
The ACEF score demonstrated effective discrimination for ≤30-day MACE and mortality. Its simplicity, accessibility, and time-saving features make it a valuable tool for clinicians. While not superior to more complex risk scores, the ACEF score performs comparably well, providing a quick and user-friendly option for risk stratification in CAD patients undergoing PCI.
Impact on daily practice
The Age, Creatinine, Ejection Fraction (ACEF) score offers clinicians a fast, simple, and reliable tool for risk stratification in patients undergoing percutaneous coronary intervention (PCI). Its use of routinely available variables – age, creatinine, and ejection fraction – makes it easy to implement without requiring additional resources or complex calculations. This meta-analysis confirms its strong predictive value for short-term major adverse cardiovascular events and mortality, which is comparable to more sophisticated models. Incorporating the ACEF score into daily decision-making can support the timely identification of high-risk patients, guide post-PCI monitoring strategies, and improve communication of prognosis with patients and families. Its practicality enhances workflow efficiency, especially in resource-limited or high-volume settings.
Conflict of interest statement
The authors have no conflicts of interest to declare regarding the contents herein.