Introduction
Ischaemic heart disease is the greatest cause of mortality and loss of disability-adjusted life years worldwide, accounting for approximately 7 million deaths and 129 million disability-adjusted life years annually1. Percutaneous coronary intervention (PCI) is indicated in patients with acute coronary syndrome and has been shown to improve quality of life in those on the maximal tolerated medical therapy2. Such intervention may be associated with complications, such as postprocedural acute kidney injury, bleeding, heart failure and others.
Traditional statistical modelling methods have been adopted to predict outcomes post-PCI, involving preselecting and transforming candidate variables based on prior knowledge, applying hierarchical logistic regression to model relationships between variables and outcomes, and reducing the number of variables to create the final model3. However, this approach is limited, as it assumes a linear relationship between the variables and logarithmic odds of outcomes, and is weak to collinearity between the variables4. Conversely, machine learning (ML) algorithms are free of these linear assumptions and have the additional benefit of being able to control collinearity by regularisation of hyperparameters5.
ML is a branch of artificial intelligence which uses large datasets to produce algorithms with minimal human intervention, allowing for automated learning. ML learns from examples in training datasets by optimising algorithms according to a loss function. Different ML models exist, including adaptive boosting, k-nearest neighbours, least absolute shrinkage and selection operator (LASSO), random forest, artificial neural network, and support vector machine, amongst others.
In an age of precision medicine, ML has demonstrated its capabilities in sifting through vast amounts of clinical data and reliably predicting outcomes6, guiding clinicians in efficiently stratifying patients and making individualised treatment decisions7. Several studies have also shown significant potential in introducing ML algorithms to predict post-PCI outcomes89. Nonetheless, other studies have shown no performance benefit of ML over traditional statistical methods for clinical prediction models10. Hence, we conducted a systematic review to evaluate the effectiveness and validity of current ML models as a clinical tool to predict outcomes following PCI.
Methods
This systematic review was registered on PROSPERO (International prospective register of systematic reviews; CRD258014) and was reported according to the Preferred Reporting Items for Systematic reviews and Meta-Analyses guidelines11. Searches of four databases (PubMed, Embase, Cochrane, and Scopus) were conducted for articles published from the date of inception up to 29 May 2021. A literature search was performed using terms synonymous with “machine learning”, “prediction” and “PCI”. The full list of search terms can be found in Supplementary Table 1.
Table 1 summarises the population, intervention, comparison, outcomes, and inclusion and exclusion criteria used for study selection. Briefly, we included all cohort studies, case-control studies, and randomised controlled trials using ML to predict outcomes post-PCI. Outcomes post-PCI included those relating to mortality (all-cause mortality and in-hospital mortality), the heart (myocardial infarction, heart failure, cardiovascular death, arrhythmia, emergency coronary artery bypass graft, stent thrombosis, and coronary artery restenosis), haemodynamics (bleeding), the kidneys (acute kidney injury, contrast-induced nephropathy, and dialysis) and others (prolonged length of stay ≥7 days and stroke). The range in timeframes for outcome measurement spanned from 72 hours to 1 year.
Three reviewers independently performed the literature search, title and abstract review, full text sieve and data extraction, and all disagreements were resolved by mutual consensus. Baseline demographic information, comorbidities, follow-up duration, medication information and procedural information were collected.
For individual post-PCI outcomes, the number of patients with confirmed disease (ND), sensitivity, specificity, positive predictive value (PPV), negative predictive value (NPV), area under the curve (AUC), and accuracy were collected for each ML model, when reported. The checklist developed by Banerjee et al12 was used in this study to critically appraise the included studies, mainly along the stages of the translational pathway: development, validation and impact. Quality of training data and methods of dealing with missing data were evaluated.
Data related to blinding and withdrawals were extracted to assess the risk of bias. Quality control was performed by two independent reviewers using the Newcastle-Ottawa Scale13 (Supplementary Table 2) and the Prediction Risk of Bias ASsessment Tool (PROBAST)14 (Supplementary Table 3). The Newcastle-Ottawa Scale for cohort studies considers three different domains: selection, comparability, and outcome. PROBAST considers four different domains: participants, predictors, analysis, and outcomes. Studies are graded as having a low, high, or an unclear risk of bias/concern regarding applicability. The Preferred Reporting Items for Systematic reviews and Meta-Analyses checklist11 is included in Supplementary Figure 1.
We included ML models that predicted in-hospital mortality, myocardial infarction, and bleeding. Diagnostic accuracy data for the included models were extracted. The ML models used comprised adaptive boosting, k-nearest neighbours, LASSO, random forest, artificial neural network, support vector machine, multilayer perceptron neural network, Naïve Bayes, extreme gradient boosting, blended model with gradient descent boosting, boosted classification trees algorithm model, and existing simplified risk score with LASSO regression.
Table 1. Population, intervention, comparison, outcomes and study (PICOS) inclusion criteria and exclusion criteria applied to database search.
| PICOS | Inclusion criteria | Exclusion criteria |
|---|---|---|
| Population | Patients who have undergone PCI | |
| Intervention | ML model | |
| Comparison | Traditional risk stratification tools (i.e., CADILLAC risk score, PAMI risk score, Zwolle risk score, GRACE hospital discharge score, dynamic TIMI risk score, RISK-PCI score, APEX AMI risk score, residual SYNTAX score, DAPT Score, GUSTO score, EPICOR prognostic model, and other scores that may be relevant) and statistical modelling | |
| Outcome | Bleeding, acute kidney injury, contrast-induced nephropathy, dialysis, heart failure, myocardial infarction, cardiovascular deaths, arrhythmias, emergency CABG, stent thrombosis, coronary artery restenosis, all-cause mortality, in-hospital mortality, prolonged length of stay more than or equal to seven days, and stroke | |
| Study design | Articles in English | Case reports and series, systematic reviews, narrative reviews, qualitative reviews, letters to the editor, non-human studies, abstract only (conference papers), non-peer-reviewed articles |
| Cohort studies, case-control studies, randomised controlled trials | ||
| Year of publication: date of inception-29 May 2021 | ||
| Databases: PubMed, Embase, Cochrane, Scopus | ||
| APEX AMI: Assessment of Pexelizumab in Acute Myocardial Infarction; CABG: coronary artery bypass graft; CADILLAC: Controlled Abciximab and Device Investigation to Lower Late Angioplasty Complications; DAPT: dual antiplatelet therapy; EPICOR: long-tErm follow uP of antithrombotic management patterns In acute CORonary syndrome patients; GRACE: Global Registry of Acute Coronary Events; GUSTO: Global Use of Strategies To Open Occluded Coronary Arteries; ML: machine learning; PAMI: Primary Angioplasty in Myocardial Infarction; PCI: percutaneous coronary intervention; PICOS: population, intervention, comparison, outcome, study; TIMI: Thrombolysis in Myocardial Infarction | ||
Results
The Preferred Reporting Items for Systematic reviews and Meta-Analyses flowchart is presented in Figure 1. A literature search of the four databases (PubMed, Embase, Cochrane, Scopus) retrieved 2,546 results. There were 727 duplicates, which were removed. Title and abstract screening excluded a further 1,635 articles as they either did not use ML to predict outcomes post-PCI, did not mention PCI, or had insufficient statistical reporting of post-PCI outcomes. Full text screening excluded 173 articles. Eleven studies were included for the systematic review.
The 11 studies comprised a combined cohort of 4,943,425 patients39151617181920212223. Gao 2020 included 2 separate cohorts, comprising 1 retrospective and 1 prospective cohort17. Thus, while the flowchart in Figure 1 shows 11 included studies, 12 cohorts were analysed in total. Across the studies, the reported post-PCI outcomes included in-hospital mortality, myocardial infarction, bleeding, and acute kidney injury. The characteristics of the included studies are shown in Table 2. Additional data relating to participant baseline characteristics, including demographics, medications used, and information relating to procedure(s), are presented in Supplementary Table 4, Supplementary Table 5, and Supplementary Table 6, respectively.
The sensitivity, specificity, PPV, NPV, and accuracy for the ML models used to predict in-hospital mortality, myocardial infarction, bleeding, in-hospital mortality and acute kidney injury for each included study are presented in Table 3. As seen, the sensitivity, specificity, PPV, NPV and accuracy are consistently high across all models.
Among the 11 studies, different ML models were used, and their methods of derivation varied. Clinical predictors and outcomes for training the ML models utilised in the 11 studies are summarised in Table 4. A summary of ML modalities, including the ML model used, software algorithm, training procedure, and optimisation of metrics, is presented in Table 4. The quality of training data, including type of study, cohort size, normalisation/standardisation, and validation, is presented in Table 4 and Supplementary Table 7. Table 5 summarises the studies included for each post-PCI outcome. In all, four studies investigated bleeding outcomes, three studies investigated acute kidney injury outcomes, five studies investigated in-hospital mortality and one study investigated myocardial infarction (Table 3, Table 5). Two studies used artificial neural networks, two used support vector machines, two used random forest algorithms, three used logistic regression models, one used a blended model with gradient descent boosting, two used LASSO techniques, two used adaptive boosting, two used extreme gradient boosting, one used a boosted classification tree algorithm (AI-BR) model, and one used a k-nearest neighbour algorithm. There were concerns about the development of the models. Of the 11 included studies, 10 were studies conducted using data from a single country (seven in the USA, two in China, one in Japan); only one study was a multinational study. The methods of dealing with missing data were another issue that surfaced. The most common way of dealing with missing data was imputation. However, four studies did not discuss how missing data were handled. One study removed patients if any of the predictor variable data points were missing. In the validation stage, most studies utilised internal validation methods, with four studies using holdout analysis by splitting the dataset into training and test sets, and five studies using N-fold cross-validation. Only three studies externally validated the models presented. There could be concerns over the applicability of the models. While most of the studies presented evidence that the model can be used and interpreted in the clinical context, none of the studies discussed the cost-effectiveness of implementing the model.
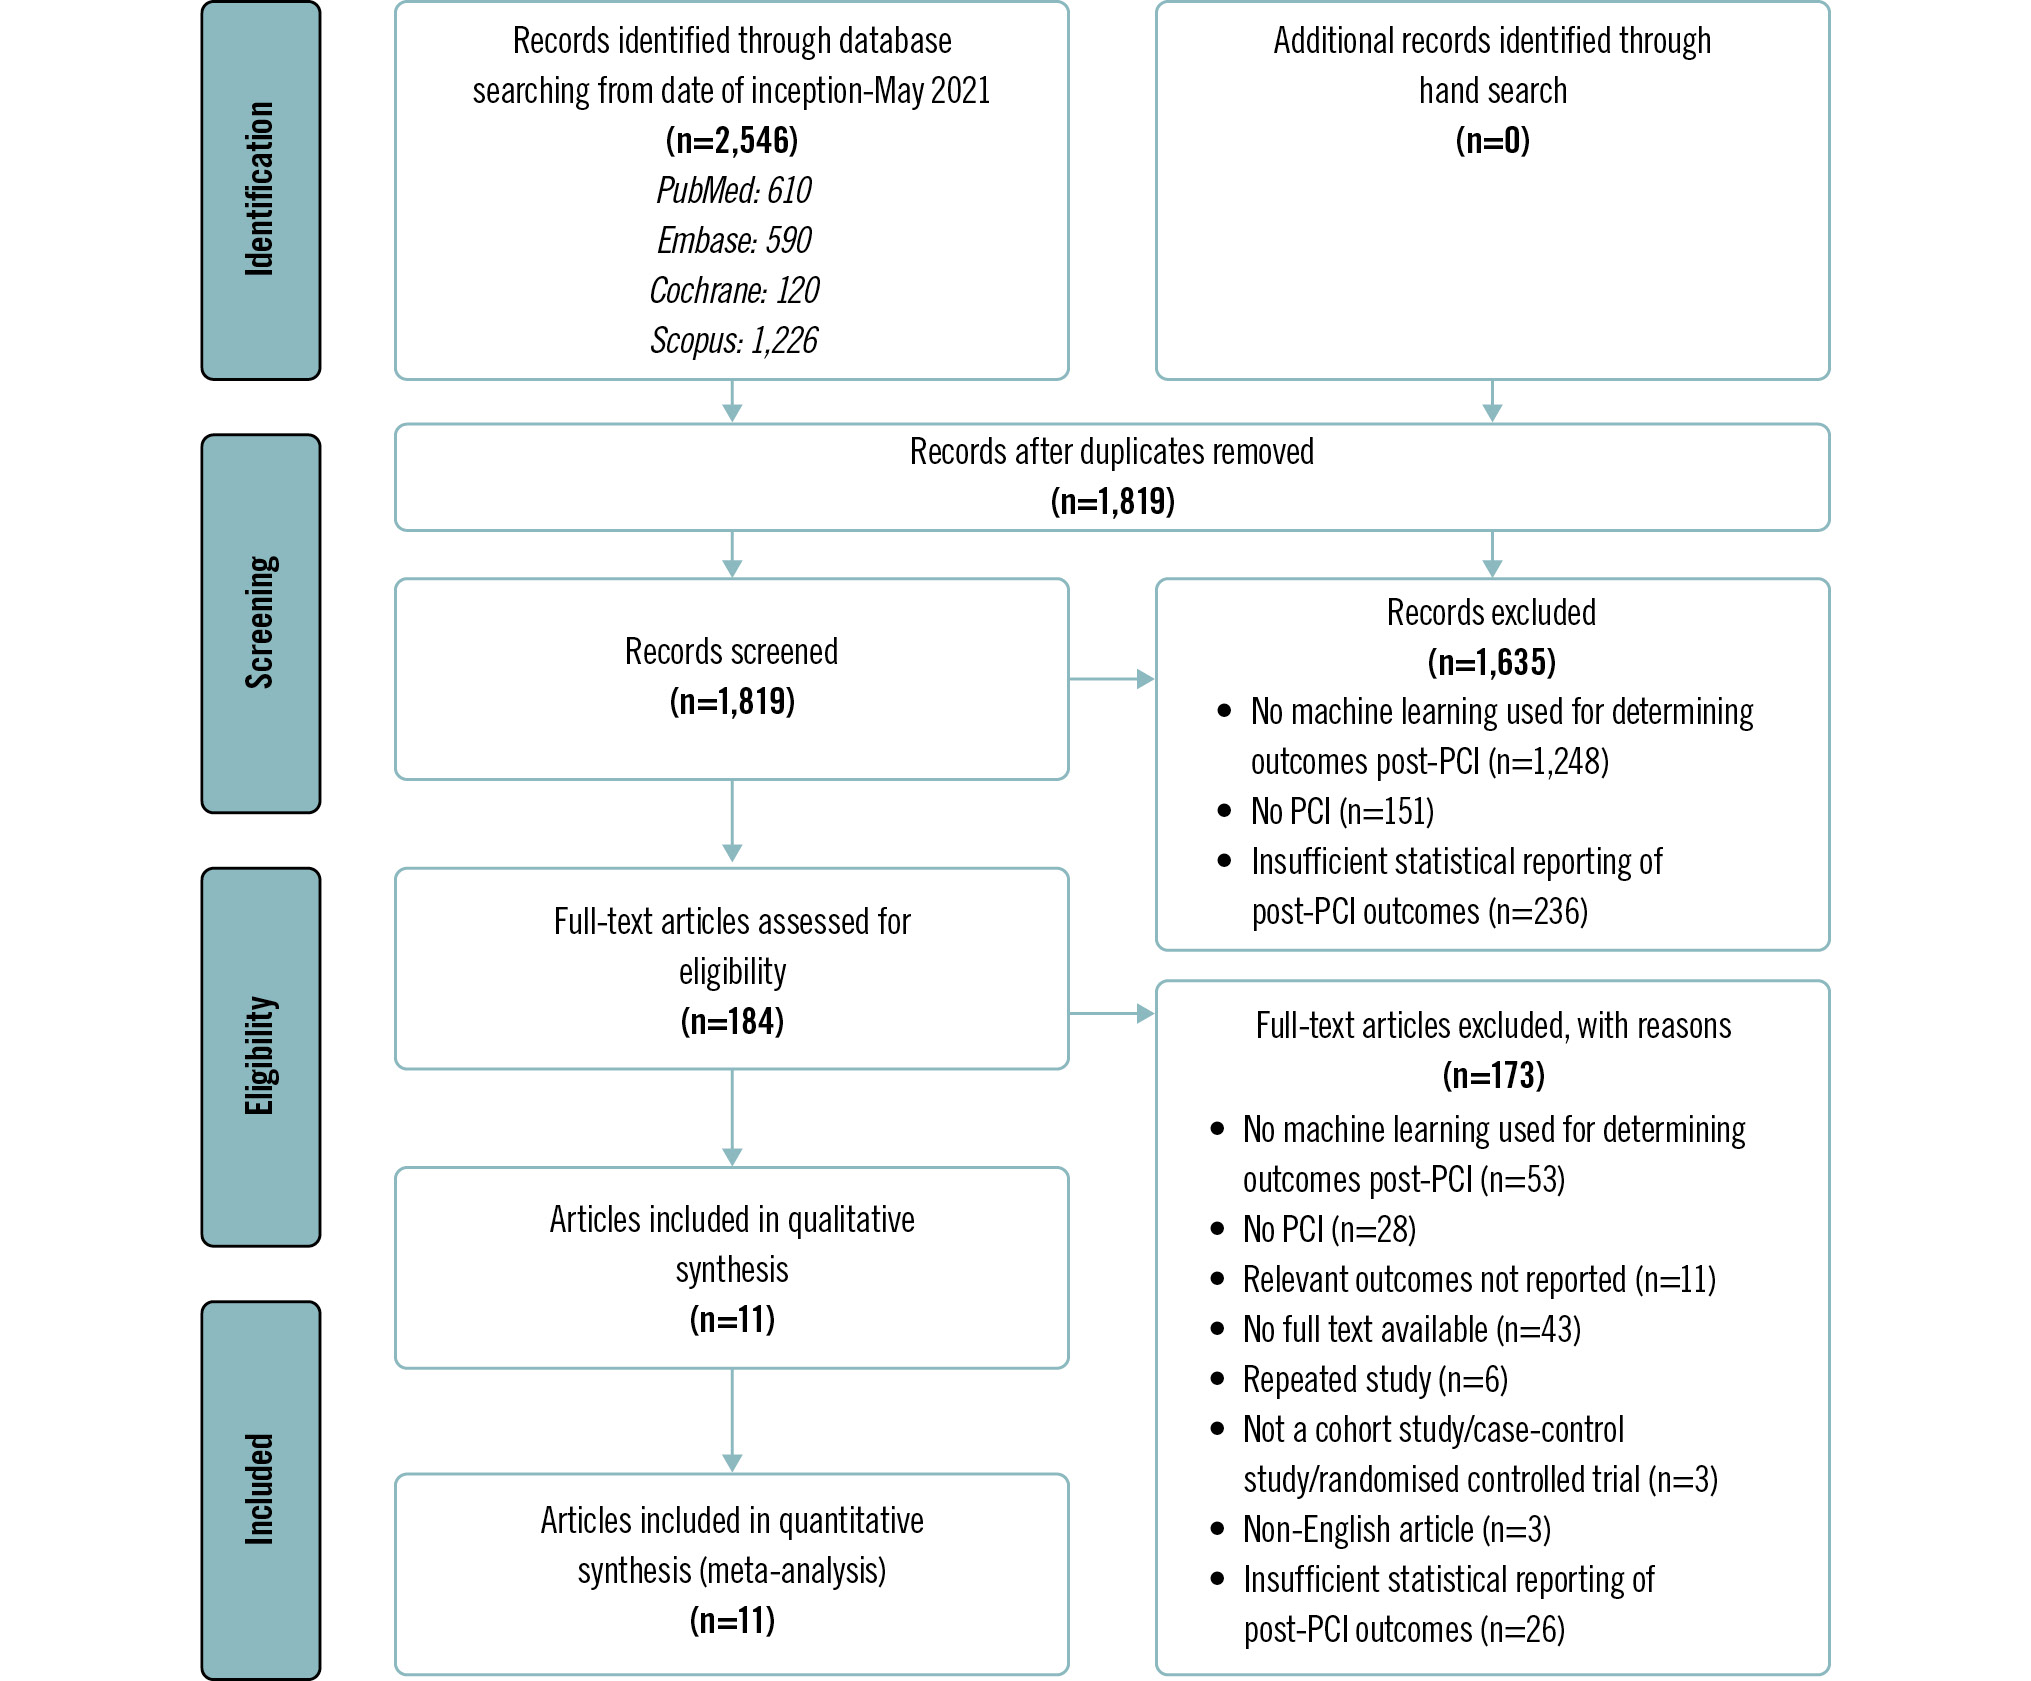
Figure 1. Preferred Reporting Items for Systematic reviews and Meta-Analyses (PRISMA) flow diagram of study selection. PCI: percutaneous coronary intervention
Table 2. Characteristics of included studies.
| Study name | Study type | Country | Data source | Dates | Inclusion | Exclusion | Sample size | Machine learning model |
|---|---|---|---|---|---|---|---|---|
| Al'Aref 201919 | Cohort – retrospective | USA | New York PCIRS | 1 January 2004 to 31 December 2012 | All patients who underwent PCI in the state of New York from 1 January 2004 until 31 December 2012 as documented in the PCIRS database, comprising all elective and emergent cases covering the spectrum of coronary artery disease presentations | Nil | 479,804 | Adaptive boosting, random forest, XGBoost |
| D'Ascenzo 202116 | Cohort – retrospective | BleeMACS: North and South America, Europe, and Asia; RENAMI: Spain, Italy, Switzerland, Greece, Serbia, United Kingdom | BleeMACS and RENAMI registries | BleeMACS: 1 January 2003 to 31 December 2014RENAMI: 1 January 2012 to 31 December 2016 | BleeMACS: consecutive patients discharged with a diagnosis of ACS undergoing PCI at 1-year follow-up (except death)RENAMI: patients with ACS who underwent PCI and were discharged with DAPT with acetylsalicylic acid plus prasugrel 10 mg once daily or acetylsalicylic acid plus ticagrelor 90 mg twice daily between January 2012 and January 2016 | BleeMACS: patients who died during hospitalisation, patients without coronary artery disease, patients who did not undergo PCI (simple balloon angioplasty, stent implantation and/or thromboaspiration). RENAMI: nil | 19,826 | Adaptive boosting, k-nearest neighbours, Naïve Bayes, random forest |
| Gao 202017 | Cohort – retrospective (training set) – prospective (validation set) | China | Hebei General Hospital, Baoding First Central Hospital, and Cangzhou Central Hospital | Training set: January 2016 to December 2018Validation set: July 2018 to December 2018 | Patients who met the diagnostic criteria of acute STEMI and underwent primary PCI according to current guidelines between the respective time periods for training and validation sets | NR | 1,169 (training set); 316 (validation set) | LASSO |
| Gurm 201421 | Cohort – retrospective | USA | BMC2 | July 2009 to December 2012 | All consecutive patients who underwent PCI between July 2009 and December 2012 | Patients who underwent coronary artery bypass grafting during the same hospitalisation | 72,328 (training cohort); 30,966 (validation cohort) (PCI procedures) | Random forest |
| Huang 20183 | Cohort – retrospective | USA | NCDR CathPCI Registry | 1 June 2009 to 30 June 2011 | Patients who underwent PCI procedures | PCIs that were not the first procedure during a single hospitalisation (n=32,999), procedures with same-day discharge (n=41,570), missing serum creatinine before or after the procedure (n=208,158), procedures on patients already on dialysis at the time of their PCI (n=24,271) | 947,091 | Logistic regression, XGBoost, LASSO regularisation, LASSO regression |
| Kulkarni 202123 | Cohort – retrospective | USA | NCDR CathPCI Registry for 5 BJC HealthCare hospitals | 1 July 2009 to 30 April 2018 | Patients undergoing PCI at 5 hospitals in the Barnes-Jewish hospital system | NR | 28,005 PCIs on 26,784 patients | ANN MLP model |
| Kuno 202122 | Cohort – prospective | Japan | JCD-KiCS registry | September 2008 to March 2019 | Patients undergoing PCI under JCD-KiCS | Patients undergoing chronic dialysis (n=912), patients with missing data on creatinine (n=3,144), haemoglobin (n=3,617) or baseline information e.g., age, sex (n=2,216) | 14,273 | MLP neural network, logistic model |
| Matheny 200720 | Cohort – retrospective | USA | BWH | 1 January 2002 to 31 December 2005 | All cases of percutaneous coronary intervention performed at BWH | NR | 7,914 PCIs | Support vector machine |
| Mortazavi 201915 | Cohort – retrospective | USA | NCDR CathPCI Registry data, version 4.4 | 1 July 2009 to 1 April 2015 | Patients undergoing the first PCI procedure within same hospitalisation | Not the index PCI of admission, hospital site missing outcome measures, patients who underwent subsequent coronary artery bypass grafting, patients who died in the hospital the same day as the procedure | 3,316,465 | Blended model with gradient descent boosting, existing simplified risk score with LASSO regularisation |
| Rayfield 20209 | Cohort – retrospective | USA | Mayo Clinic PCI database across 4 sites (La Crosse, Wisconsin; Mankato, Minnesota; Rochester, Minnesota; and Phoenix, Arizona) | January 2006 to December 2017 | Patients who had PCI done between January 2006 and December 2017 | If any of the 86 variable data points, including bleeding data, were missing | 15,603 | AI-BR model |
| Wang 202018 | Cohort – retrospective | China | EHR of inpatients who were admitted to the Department of Cardiology at Sir Run Run Shaw Hospital (Hangzhou, Zhejiang, China) | December 2007 to April 2019 | 1. Inpatients with single coronary artery stenosis (left main artery, left anterior descending artery, left circumflex artery, or right coronary artery);2. Inpatients with stent implantation during this in-hospital period;3. From December 2007 to April 2019 | 1. Myocardial infarction patients or elevated preprocedural cTnI or CK-MB;2. PCI for more than one artery;3. Coronary artery with thrombosis;4. Transluminal extraction-atherectomy therapy for culprit artery;5. Severe heart failure (EF <45% or NT-proBNP >2,000);6. Severe valve disease | 10,886 | Artificial neural networks,support vector machine |
| ACS: acute coronary syndrome; AI-BR: boosted classification tree algorithm; ANN: artificial neural network; BJC: Barnes-Jewish Corporation; BleeMACS: Bleeding complications in a Multicenter registry of patients discharged with diagnosis of Acute Coronary Syndrome; BMC2: Blue Cross Blue Shield of Michigan Cardiovascular Consortium 2; BWH: Brigham and Women's Hospital; CK-MB: creatinine kinase myocardial band; cTnI: cardiac troponin I; DAPT: dual antiplatelet therapy; EF: ejection fraction; EHR: electronic health record; JCD-KiCS: Japanese Cardiovascular Database-Keio interhospital Cardiovascular Studies; LASSO: least absolute shrinkage and selection operator; MLP: multilayer perceptron; NCDR: National Cardiovascular Data Registry; NR: not reported; NT-proBNP: N-terminal pro B-type natriuretic peptide; PCI: percutaneous coronary intervention; PCIRS: Percutaneous Coronary Interventions Reporting System; RENAMI: REgistry of New Antiplatelets in patients with Myocardial Infarction; STEMI: ST-segment elevation myocardial infarction; XGBoost: eXtreme Gradient Boosting | ||||||||
Table 3. Sensitivity, specificity, PPV, NPV, and accuracy reported by studies that applied an ML method to predict different clinical outcomes post-percutaneous coronary intervention.
| Model | ML model | Sensitivity | Specificity | PPV | NPV | Accuracy | AUC |
|---|---|---|---|---|---|---|---|
| In-hospital mortality (best) | |||||||
| D'Ascenzo 202116 | K-nearest neighbour | 0.57 (0.53, 0.61) | |||||
| D'Ascenzo 202116 | Adaptive boosting | 0.91 (0.91, 0.91) | 0.21 (0.19, 0.23) | 0.98 (0.98, 0.98) | 0.89 (0.89, 0.90) | 0.82 (0.79, 0.85) | |
| Gao 202017 (training set) | LASSO | 0.98 (0.93, 0.99) | |||||
| Gao 202017 (validation set) | LASSO | 0.95 (0.92, 0.97) | 0.63 (0.47, 0.77) | 1.00 (0.98, 1.00) | 0.95 (0.92, 0.97) | 0.99 (0.98, 1.00) | |
| Al'Aref 201919 | Adaptive boosting | 0.93 (0.92, 0.93) | |||||
| Matheny 200720 | SVM | 0.92 (0.91, 0.92) | |||||
| Kulkarni 202123 | ANN | 0.92 (0.90, 0.94) | |||||
| In-hospital mortality (worst) | |||||||
| D'Ascenzo 202116 | K-nearest neighbour | 0.88 (0.87, 0.89) | 0.17 (0.16, 0.19) | 0.98 (0.98, 0.98) | 0.87 (0.86, 0.87) | ||
| D'Ascenzo 202116 | Adaptive boosting | 0.55 (0.51, 0.59) | 0.82 (0.79, 0.85) | ||||
| Gao 202017 (training set) | LASSO | 0.92 (0.90, 0.93) | 0.51 (0.44, 0.58) | 1.00 (0.99, 1.00) | 0.92 (0.90, 0.94) | 0.99 (0.98, 0.99) | |
| Gao 202017 (validation set) | LASSO | 0.96 (0.80, 0.99) | |||||
| Al'Aref 201919 | Random forest | 0.89 (0.89, 0.90) | |||||
| Matheny 200720 | SVM | 0.88 (0.87, 0.88) | |||||
| Kulkarni 202123 | ANN | 0.81 (0.76, 0.86) | |||||
| Myocardial infarction (best) | |||||||
| D'Ascenzo 202116 | Random forest | 0.67 (0.63, 0.71) | |||||
| D'Ascenzo 202116 | Adaptive boosting | 0.79 (0.78, 0.80) | 0.10 (0.09, 0.11) | 0.98 (0.98, 0.98) | 0.78 (0.78, 0.79) | ||
| Wang 202018 | SVM | 0.73 (0.71, 0.75) | |||||
| Wang 202018 | ANN | 0.72 (0.70, 0.74) | 0.71 (0.69, 0.73) | 0.73 (0.71, 0.75) | 0.72 (0.71, 0.73) | ||
| Myocardial infarction (worst) | |||||||
| D'Ascenzo 202116 | Random forest | 0.63 (0.62, 0.64) | 0.07 (0.06, 0.07) | 0.98 (0.98, 0.98) | 0.63 (0.62, 0.64) | ||
| D'Ascenzo 202116 | Adaptive boosting | 0.58 (0.54, 0.62) | |||||
| Wang 202018 | SVM | 0.65 (0.63, 0.67) | 0.67 (0.65, 0.69) | 0.71 (0.69, 0.73) | 0.69 (0.68, 0.70) | ||
| Wang 202018 | ANN | 0.72 (0.70, 0.74) | |||||
| Bleeding (best) | |||||||
| Mortazavi 201915 | Blended model with gradient descent boosting | 0.37 (0.37, 0.37) | 0.95 (0.95, 0.95) | 0.27 (0.26, 0.27) | 0.97 (0.97, 0.97) | 0.93 (0.93, 0.93) | |
| Rayfield 20209 | Boosted classification tree algorithm | 0.77 (0.72, 0.82) | 0.81 (0.80, 0.82) | 0.07 (0.06, 0.08) | 0.99 (0.99, 1.00) | 0.81 (0.80, 0.81) | |
| Gurm 201421 | Random forest | 0.89 (0.88, 0.90) | |||||
| Kulkarni 202123 | ANN | 0.80 (0.86, 0.89) | |||||
| Bleeding (worst) | |||||||
| Mortazavi 201915 | Existing simplified risk score with LASSO regularisation | 0.35 (0.35, 0.35) | 0.93 (0.93, 0.93) | 0.20 (0.20, 0.20) | 0.97 (0.97, 0.97) | 0.91 (0.91, 0.91) | |
| Rayfield 20209 | Boosted classification tree algorithm | 0.77 (0.72, 0.82) | 0.81 (0.80, 0.82) | 0.07 (0.06, 0.08) | 0.99 (0.99, 1.00) | 0.81 (0.80, 0.81) | |
| Gurm 201421 | Random forest | 0.88 (0.87, 0.89) | |||||
| Kulkarni 202123 | ANN | 0.73 (0.71, 0.76) | |||||
| Acute kidney injury (best) | |||||||
| Huang 20183 | XGBoost | 0.76 (0.76, 0.76) | |||||
| Kulkarni 202123 | ANN | 0.82 (0.81, 0.83) | |||||
| Kuno 202122 | Logistic regression | 0.83 (0.81, 0.84) | |||||
| Acute kidney injury (worst) | |||||||
| Huang 20183 | Logistic regression | 0.71 (0.71, 0.71) | |||||
| Kulkarni 202123 | ANN | 0.63 (0.59, 0.66) | |||||
| Kuno 202122 | Logistic regression | 0.81 (0.80, 0.83) | |||||
| Values in parentheses are 95% confidence intervals. ANN: artificial neural network; AUC: area under the curve; LASSO: least absolute shrinkage and selection operator; ML: machine learning; NPV: negative predictive value; PPV: positive predictive value; SVM: support vector machine; XGBoost: eXtreme Gradient Boosting | |||||||
Table 4. Systematic review and quality assessment of included studies.
| Author | Al’Aref19 | D’Ascenzo16 | Gao17 | Gurm21 | Huang3 | Kulkarni23 | Kuno22 | Matheny20 | Mortazavi15 | Rayfield9 | Wang18 |
|---|---|---|---|---|---|---|---|---|---|---|---|
| Type of study | Cohort – retrospective | Cohort – retrospective | Cohort – retrospective (training set)Cohort – prospective (validation set) | Cohort – retrospective | Cohort – retrospective | Cohort – retrospective | Cohort – retrospective | Cohort – retrospective | Cohort – retrospective | Cohort – retrospective | Cohort – retrospective |
| Cohort size | 479,804 | 19,826 | 316 | 30,985 | 947,091 | 26,784 | 14,273 | 7,914 PCIs | 3,316,465 | 15,604 | 10,886 |
| Cohort country | USA | 15 tertiary hospitals in North and South America, Europe, and Asia+12 European hospitals | China | USA | USA | USA | Japan | USA | USA | USA | China |
| Development | |||||||||||
| Cohort population | PCIRS database | BleeMACS registry (ClinicalTrials.gov: NCT02466854) and the RENAMI registry+RENAMI | Hebei General Hospital, Baoding First Central Hospital, and Cangzhou Central Hospital | BMC2: all non-federal hospitals in the state of Michigan | NCDR CathPCI | Seven hospitals – Alton Memorial Hospital, Alton, IL; Barnes-Jewish Hospital, St.Louis, MO; Barnes-Jewish St. Peters Hospital, St. Peters, MO; Boone Hospital Center, Columbia, MO; Christian Hospital, St Louis, MO; Missouri Baptist Medical Center, St. Louis, MO; and Progress West HealthCare, O’Fallon, MO | JCD-KiCS registry | BWH (Boston, MA) containing all cases (7,914) of PCI performed at the institution from 1 January 2002 to 31 December 2005 | NCDR CathPCI | Mayo Clinic CathPCI registry data | Sir Run Run Shaw hospital (Hangzhou, Zhejiang, China) |
| Normalisation/standardisation | Yes – done before use in model training and validation | Not reported | Yes – all data were normalised by transforming the data into new scores (z-score transformation) with a mean of 0 and a standard deviation of 1 | Not reported | Yes – may be performed during feature engineering step | Yes – normalisation done for continuous variables before use in model training and validation | Not reported | Not reported | Not reported | Not reported | Not reported |
| Validation | Yes (5-fold cross-validation) | Yes (internal validation, external validation) | Yes (internal validation, external validation) | Yes (independent validation) | Yes (temporal validation performed on a more contemporary cohort of PCI patients from the NCDR CathPCI registry) | Yes (validation with a separate retrospective dataset) | Yes (automatic system validation) | Yes (3-fold cross-validation inner and outer loop method) | Yes (5-fold cross-validation) | Yes (10-fold cross-validation) | Yes (4-fold cross-validation) |
| Machine learning model | Adaptive boosting, random forest, XGBoost, logistic regression | Adaptive boosting, k-nearest neighbour | LASSO | Random forest | Logistic regression, XGBoost | ANN MLP model | Logistic model | Support vector machine-P (CEE)-optimised, support vector machine-R (MSE)-optimised | Blended model with gradient descent boosting, existing simplified risk score with LASSO regression | AI-BR model | Artificial neural networks, support vector machine |
| Software algorithm | Not reported | SPSS Statistics, version 24.0 (IBM) | R software, version 3.3.0 (R Foundation for Statistical Computing) and Glmnet R package was used for the LASSO regression model | R software, version 2.14.1, using freely distributed contributed packages | All analyses were developed in R. LASSO regularisation with logistic regression was performed using the Glmnet R package. XGBoost was performed using the XGBoost R package. Brier score, reliability, and resolution were calculated with the SpecsVerification R package | All analyses were carried out on R statistical software or Stata (StataCorp) | Statistical calculations and analyses performed using SPSS Statistics, version 24, R 3.5.3 and Python 3.7 (Python Software Foundation) | SVM models were developed using GIST (Columbia University, New York, NY, USA) 2.2.1. LR models were developed using SAS, version 9.1 (SAS Institute) | All analyses were conducted in R (version 3.3.2), with Glmnet used for LASSO regularisation, XGBoost for gradient descent boosting and pROC for C statistics; mgcv and sandwich were used for the continuous calibration curves and SpecsVerification was used for the Brier score | R software, version 3.5.1 | Python 3.x software+SPSS Statistics for macOS, version 23 |
| Development | |||||||||||
| Training procedure | 5-fold cross-validation on the dataset for each model. Attribute selection was done after fine-tuning of the hyperparameter – defined as the model parameters that are given an arbitrary value before the initiation of the learning process. Attribute selection was performed using the information gain ranking method that aims at ranking features based on high information gain entropy. The attributes with information gain >0 were only used for the ML approach. | The derivation cohort was randomly split into 2 datasets: a training (80%) cohort, which was used to train the 4 ML models and tune their parameters, and an internal validation (20%) cohort, which was used to test the developed models on unseen data and to fine-tune the hyperparameters. To determine the major predictors of each study outcome in our patient population, the importance of each permutation feature was measured from the final model. Permutation feature importance computes the value of each feature included in the model by calculating the increase in the model’s prediction error after permuting its values. A feature is considered important if permuting its values decreases the model’s discriminative capability, as the model relies heavily on that feature for the prediction. | The LASSO method was used to select the features that were the most significantly associated with the outcome (in-hospital mortality). Then, a regression model was built using the selected variables. The λ value was selected for which the cross-validation error was the smallest. Finally, the model was refitted using all available observations and the selected λ. Thus, most of the coefficients of the covariates were reduced to 0, and the remaining non-zero coefficients were selected by LASSO. | The study cohort was divided randomly into training and validation datasets, with 70% of procedures assigned to training, and the remaining 30% utilised for validation. A random forest regression model was trained for predicting transfusion using 45 baseline clinical variables including preprocedural medications, with missing predictors imputed to be the overall median for continuous values and mode for categorical variables. The transfusion outcome was entered as a continuous variable coded as 1 in patients who were transfused, and 0 for those not meeting the criteria to facilitate regression rather than classification modelling, so that estimated means (leaf node probabilities of transfusion) assigned to a given observation were then aggregated in the ensemble. To facilitate the development of an easy-to-use bedside tool, a reduced model was also trained using only the 14 most important predictors as assessed in the full model by the incremental decrease in node impurity (residual sum of squares) associated with splitting on the predictor averaged over all trees in the ensemble. | 9 prediction models were developed, with combinations of the following 3 categories: (1) preprocessing models (strategy A vs strategy B), (2) variable selection (stepwise backward selection with logistic regression vs LASSO regularisation with logistic regression vs permutation-based selection with XGBoost) and (3) relationship modelling: (logistic regression model vs ML method XGBoost).Analytic cohort was randomly split into a training set (70% of the cohort) and a test set (30% of the cohort). The 9 models were built using data from the training set only, and the corresponding selected variables were recorded. Finally, the performance of the models was assessed on the internal test set. | Randomly shuffled dataset was split into a derivation set (n=21,004) and a validation dataset (n=7,001). All training for ML algorithms used data from the derivation set, while all models were validated on data from the validation set. Data preprocessing was undertaken using variable encoding. The 2 generated datasets were used to develop 2 separate learning models for each outcome – one incorporating baseline and pre-PCI variables, and the other incorporating variables related to the PCI procedure. Predictions from these two models were then finally combined into a single prediction model using logistic regression. For each training epoch, the estimated best fitting model was independently applied to the test set (the encoded dataset obtained from the validation set) to trace the classification accuracy. Model training continued as long as there was improvement in the classification accuracy for both the training and the independently assessed test set. If the model only showed accuracy improvement in the training set but showed a decreased accuracy for the test set, then a potential overfitting was interpreted, and model training was stopped. | Restricted cubic spline with multivariate logistic regression models were used to assess the association between absolute/relative decrease in haemoglobin and AKI. ML was constructed with a neural network to evaluate the association between periprocedural haemoglobin reduction and AKI and for risk stratification of AKI, by comparing the effect of NCDR variables versus NCDR variables plus haemoglobin absolute change (continuous value) versus NCDR variables plus haemoglobin relative change (continuous value) and with logistic models. | The cases were used to generate 100 random datasets. All cases were used in each set, and 5,540 were allocated for training and 2,374 were allocated for testing. For SVM evaluation, each training set was randomly divided into 3,957 kernel training and 1,583 sigmoid training portions. The parameter of each kernel type (d and w for the polynomial and Gaussian kernels, respectively) and the magnitude of the constant applied to the soft margin were optimised on the kernel training set separately for AUC, HL χ2, MSE, and CEE indices by a grid search method, using 3-fold cross- validation. The sigmoid training set was used to convert SVM results into probabilities. Using the training set cross-validation results for each of the performance measures, the best set of parameters for the radial and polynomial kernels were used to generate a model on the entire kernel training set, and a sigmoid for discriminant conversion was generated using the sigmoid training set. Each of the models was then evaluated using the respective test dataset. Logistic regression was chosen to provide the benchmark for SVM comparisons, with similar 3-fold cross-validation performed on each training dataset to optimise feature selection threshold for AUC, HL χ2, MSE, and CEE performance measures. | Derivation and validation cohorts were created using stratified 5-fold cross-validation. Each variable set was divided randomly into 5 equal subsets, preserving the same event rate in each subset, by first randomly dividing bleeding cases and then non-bleeding cases. Each bleeding subset was then paired with 1 non-bleeding subset. The derivation cohort combined 4 (80%) of the subsets; the remaining subset (20%) was reserved as a validation set. This process was repeated 5 times, such that each of the subsets served as the validation set. Two methods were used to train models in the analysis: logistic regression with LASSO regularisation and gradient descent boosting – XGBoost. The final model used 1,000 trees, a learning rate of 0.1, and a maximum depth of each tree of 6, and it was trained with an objective function aimed at minimising errors similar to logistic regression for binary classification (bleed vs non-bleed). | All recorded variables were considered candidate variables. The variables, once scaled, were fed into an AI-BR. This model trained the base estimator on the training set and observed the training data samples that the base estimator misclassified and created a weighted coefficient for these samples. A second base estimator was then trained, applying the above weight coefficient, to samples when calculating the entropy measure of homogeneity. Boosting was performed to create successive base classifiers that were programmed to place greater emphasis on the misclassified samples from the training data. Finally, a probability of class membership was calculated based on the sum of the individual tree results for each patient. If the sum was >50% probability of bleeding, the patient was predicted to have bled. | Feature selection by information gain measured how much information an attribute gave researchers about the outcome to be predicted. Class-balanced oversampling method was another approach to balance the imbalanced dataset. Drop imputation and mean imputation were individually applied in the dataset to build ML models. |
| Optimising metrics | AUC | AUC | AUC | AUC | AUC, Brier score, resolution, reliability | AUC | AUC | AUC, mean squared error, mean CEE, HL goodness-of-fit test | AUC | ROC curve | AUC of ROC curve |
| AI-BR: boosted classification tree algorithm; AKI: acute kidney injury; ANN: artificial neural network; AUC: area under the curve; BleeMACS: Bleeding complications in a Multicenter registry of patients discharged with diagnosis of Acute Coronary Syndrome; BMC2: Blue Cross Blue Shield of Michigan Cardiovascular Consortium 2; BWH: Brigham and Women’s Hospital; CEE: cross-entropy error; HL: Hosmer-Lemeshow; JCD-KiCS: Japanese Cardiovascular Database-Keio interhospital Cardiovascular Studies; LASSO: least absolute shrinkage and selection operator; LR: logistic regression; ML: machine learning; MLP: multilayer perceptron; MSE: mean squared error; NCDR: National Cardiovascular Data Registry; PCI: percutaneous coronary intervention; PCIRS: Percutaneous Coronary Interventions Reporting System; RENAMI: REgistry of New Antiplatelets in patients with Myocardial Infarction; ROC: receiver operating characteristic; SVM: support vector machine; XGBoost: eXtreme Gradient Boosting | |||||||||||
Table 5. Summary table of studies included for each outcome
| Outcome | Number of studies | Studies included |
|---|---|---|
| Bleeding AUC | 2 | Gurm 201421Kulkarni 202123 |
| Acute kidney injury AUC | 3 | Huang 20183Kulkarni 202123Kuno 202122 |
| In-hospital mortality AUC | 5 | D’Ascenzo 202116Gao 202017Al’Aref 201919Matheny 200720Kulkarni 202123 |
| Bleeding sensitivity, specificity, PPV, NPV, and accuracy | 2 | Mortazavi 201915Rayfield 20209 |
| Myocardial infarction sensitivity, specificity, PPV, NPV, and accuracy | 1 | D’Ascenzo 202116 |
| In-hospital mortality sensitivity, specificity, PPV, NPV, and accuracy | 2 | D’Ascenzo 202116Gao 202017 |
| AUC: area under the curve; NPV: negative predictive value; PPV: positive predictive value | ||
Discussion
In this systematic review, we demonstrated that ML models may be useful as an adjunct to existing traditional risk stratification scores in predicting outcomes post-PCI, with moderate to high NPV and AUC.
Traditional risk stratification scores used to predict outcomes post-PCI include the Primary Angioplasty in Myocardial Infarction risk score24, the RISK-PCI score25, and the New Mayo Clinic Risk Score26. However, such scores are limited by their primary reliance on linear models and diminished ability to explore higher order interactions27, as they are built on parametric and semiparametric regression scoring systems. Traditional statistical modelling, which is also used to predict outcomes post-PCI, assumes a linear relationship between the variables and logarithmic odds of outcomes4. These limitations render traditional risk stratification scores and statistical modelling effective at making predictions at a population level, but less effective at accurately predicting an individual’s risk28.
Compared to the ML models21, the AUCs for bleeding using traditional scores, such as the Primary Angioplasty in Myocardial Infarction risk score, Thrombolysis in Myocardial Infarction (TIMI) risk score, Global Registry of Acute Coronary Events risk score, and Controlled Abciximab and Device Investigation to Lower Late Angioplasty Complications risk score (AUC=0.60, 0.62, 0.58, and 0.79, respectively)29, demonstrated lower values. This suggests a better performance of ML models, compared to traditional predictive models, in prognosticating patients for bleeding risk post-PCI. Compared to that of the best ML models2223, the AUC for predicting acute kidney injury using the Primary Angioplasty in Myocardial Infarction risk score (AUC=0.71)29 demonstrated a lower value, whilst ML models were outperformed by other traditional risk models such as the TIMI risk score, Global Registry of Acute Coronary Events risk score, and Controlled Abciximab and Device Investigation to Lower Late Angioplasty Complications risk score (AUC=0.83, 0.78, and 0.98, respectively)29. Several studies have also shown traditional statistical methods to have a similar performance to ML in clinical prediction situations1030. Hence, traditional risk stratification scores and statistical modelling are still crucial in clinical practice, but ML models, which are free of linear assumptions and have the additional benefit of being able to control collinearity by optimising hyperparameters5, may be used as an adjunctive tool to augment clinicians’ decision-making regarding personalised risk-benefit analysis3132 on whether or not a patient should undergo elective PCI.
In contrast to traditional statistical methods, ML models tend to incorporate a diverse range and greater number of clinically relevant key variables in the training process, comprising demographic characteristics, medical history, preprocedural imaging characteristics, and procedural characteristics, as well as postprocedural complications and outcomes (Supplementary Table 8). This facilitates the development of a more robust algorithm, guiding the prediction of post-PCI outcomes in clinical practice in a more precise manner.
Moreover, ML models, especially deep learning models, are adept in handling high-dimensional and complex data. This is particularly beneficial in healthcare systems, where a vast amount of data is constantly generated from diverse sources. While traditional methods can capture non-linear relationships, ML models can do so in a more flexible manner and without need for explicit specification of polynomial terms and interaction variables. In addition, techniques like cross-validation and regularisation in ML can facilitate the development of models that generalise better on unseen data, a key consideration in clinical applications.
It is worthwhile to note that Greenhalgh et al previously published a multilevel non-adoption, abandonment, scale-up, spread, and sustainability (NASSS) framework for studying the diffusion of innovations and promoting technology adoption in healthcare systems33. This framework takes into account key factors including the condition, technology, value proposition, adopters, organisation, the wider system, and adaptation over time. Application of this framework to ML models in PCI could potentially aid in the translation of algorithmic success to patient benefit.
The high NPVs using the ML models for in-hospital mortality, myocardial infarction, and bleeding, of 100%, 99%, and 98%, respectively, demonstrate that patients who were predicted not to have poor outcomes post-PCI indeed did not suffer from such complications, thus guiding risk-benefit analysis for PCI. Poor outcomes such as in-hospital mortality, myocardial infarction, and bleeding, might diminish the overall utility of PCI. The high discriminatory value serves as a good adjunctive clinical tool to allow clinicians to weigh the risks and benefits of PCI for their patients.
We have also critically appraised the studies along the key elements of the translational pathway. Development is hampered by the population in each cohort. Of the 12 cohorts included, seven cohorts analysed populations in the USA391519202123, three cohorts analysed populations in China1718, one cohort analysed populations in Japan22, and one cohort analysed populations across North America, South America, Europe, and Asia16. The small number of countries where these ML models have been developed could limit the generalisability of the results to other potentially underinvestigated, underserved populations. The applicability of the results could also be reduced by the lack of external validation. To date, only one study16 externally validated the model in a multinational cohort. More resources should be allocated to validate the model and apply the results in more diverse patient populations. Another issue of missing data surfaced in our analysis. Four studies did not discuss how missing data were handled. One study conducted complete case analysis by removing patients with missing predictor variable data points. Unclear methods of handling missing data, or complete case analysis, may lead to underpowered studies or bias, especially if the data are not missing at random34.
Limitations
To the best of our knowledge, this is the first review to critically appraise and review the accuracy of ML models used in predicting outcomes post-PCI. Comprehensive data comprising baseline clinical characteristics, training procedures for ML models, quality of training data and ML outcomes were retrieved, analysed, and synthesised from individual studies to evaluate the accuracy of ML models in predicting pertinent post-PCI outcomes.
Nonetheless, this study should be interpreted in the context of known and potential limitations. Firstly, there existed significant heterogeneity among the studies included in this systematic review. For the clinical predictors reported, while the categories of predictors used were largely similar, the individual predictors included in each category differed across the studies. The baseline demographics of study populations also differed, and the duration of follow-up for post-PCI outcomes was not reported in the majority of the included studies. Most studies examined supervised machine learning techniques such as LASSO and random forest models (Table 4). Also, the performance between different models, particularly that of deep learning networks and traditional supervised ML models, was not reported. Further studies should be conducted to explore the different ML models and to determine which ML models have the best predictive performance.
Secondly, while the quality of training data was overall high, the majority of the studies (n=10) were retrospective in nature, which may further introduce bias into the training of ML models. Moreover, software algorithms and training procedures employed for ML models across studies were not standardised. Also, ML models can be very sensitive to the optimisation model chosen20. Thus, caution should be exercised before declaring any model to be superior to other risk prediction tools.
Thirdly, the “black box” technology of ML models leads to these models being complex and unpredictable because of a lack of transparency about the underlying decision-making processes. Input data may undergo complex transformations in multiple layers of the algorithm, with the relationship between individual clinical predictors and contribution of each predictor to the outcome unknown to the user35. The complex datasets utilised in ML models may also be prone to missing data, unmeasured confounding, and systemic errors, all of which may further compromise the validity of the models’ predictions [35. Also, ML models with low sensitivity may miss patients at risk of adverse outcomes post-PCI. This may impact clinicians’ ability to accurately weigh the risks and benefits of elective PCI, affect preprocedural counselling, and may potentially lead to medico-legal issues. To mitigate this issue, the developers of ML algorithms should define the purpose (screening vs diagnosis) of the ML models and choose a binary threshold in the validation set to derive appropriate sensitivities. In the usage of low-sensitivity ML models, outcome predictions made using ML models must ultimately still be interpreted cautiously in appropriate clinical contexts, which should be done by experienced clinicians.
Lastly, while the findings of our research are informative and useful for understanding PCI outcomes, it is important to acknowledge that they may not be universally applicable to all scenarios. This is due to the fact that all of the included studies are single-centre studies, four of them have unclear data handling strategies, and only three externally validated the models presented. This significantly increases the risk of overfitting to training data, limiting the interpretation of good model performance. Thus, it is challenging to comment on the definitive benefit of real-world effectiveness. The majority of the studies also focused on the USA (seven studies), with two studies focused on China, but not other countries, limiting generalisability. In light of the fact that the robustness and generalisability may be overstated, PROBAST was performed. Ultimately, outcome predictions by ML models must still be interpreted judiciously and contextualised to each case.
Conclusions
In this systematic review, we demonstrated that ML models may be a valuable clinical adjunct to existing traditional risk stratification scores in predicting outcomes post-PCI, with moderate to high NPV and AUC. Such a clinical tool may one day guide clinicians in prognostication of complications and the selection of patients with the most optimal risk-benefit profile to undergo the procedure. The limitations of the findings are difficult to address in the near future, as the data and technological needs to incorporate ML models into daily clinical practice would require some time to develop. Given the heterogeneity and retrospective design of the studies analysed, future prospective studies are required to investigate the accuracy of ML models more consistently. Employment of larger datasets to train ML models, and refinement of existing ML algorithms via improvements in development and validation may also help to improve the sensitivity, specificity, predictive values, and accuracy of ML models to facilitate their meaningful use in clinical practice.
Impact on daily practice
We suggest that machine learning (ML) can be used as an adjunct to help clinicians weigh the risks and benefits of percutaneous coronary intervention (PCI) versus continued medical therapy in elderly patients with multiple comorbidities who are at higher risk of complications. When a patient presents for elective PCI, clinicians can extract demographic data and past medical history from the electronic health records and enter them into the ML algorithm. Following a targeted history, physical examination, and investigations, clinicians can input further relevant data, including preprocedural imaging data, into the ML algorithm, to determine the potential benefit and personalised risk, so that patients can make a better-informed decision. By selecting the most suitable patients with precision medicine, morbidity, mortality, and healthcare burden can be decreased.
Availability of data and materials
Data used for this study can be accessed upon request from the prin-cipal investigator (Dr Ching-Hui Sia) at: [email protected]
Funding
C.-H. Sia was supported by the National University of Singapore Yong Loo Lin School of Medicine’s Junior Academic Fellowship Scheme.
Conflict of interest statement
H.C. Tan is a deputy editor at AsiaIntervention. The other authors have no conflicts of interest to declare.